Income opportunities in US structured products
Income paying structured products have long been popular in the US market. Currently the Income Autocall is the most common product type overall in the US with the remaining income categories of fixed income and contingent income also contributing to the total number. This article will focus on contingent income products which have a decent presence in the US market and are an interesting group.
Searching for Income
StructrPro can be used to analyse a portfolio of products from the US structured product market. This analysis includes both live and matured products from the SRP database using analytics powered by FVC. Products in the Contingent Income category on StructrPro all have a fixed maturity with no autocall or issuer call opportunities and generate returns through an income stream that is paid if the relevant underlying is above the coupon barrier. Products can be linked to a single underlying or multiple underlyings as is more common. In the US products in this category tend to be capital at risk although capital protected varieties are more often seen in other markets.
Figure 1: Performance summary of all products in contingent income category and StructrPro universe. For live products results use previous income paid plus the current independent product valuation. (StructrPro.com)
| Contingent income | Universe | |||
| LIVE | MATURED | LIVE | MATURED | |
| Gain (%) | 94.46 | 91.45 | 70.97 | 86.43 |
| Capital (%) | 0 | 0 | 0 | 29.45 |
| Loss (%) | 5.54 | 8.55 | 29.03 | 13.25 |
| Return p.a. (%) | 15.74 | 6.24 | 6.59 | 5.86 |
| SP payoff (%) | 132.2 | 114.92 | 108.35 | 110.09 |
| Time gone | 4.03 y | 2.7 y | 1.7 y | 1.59 y |
Performance and properties
Figure 1 shows the performance of contingent income products versus the StructrPro entire universe of over 70000 products. Contingent income products have outperformed the rest of the market paying average returns of 6.245% compared to 5.86% for matured products and by even more for live products with 15.74% compared to 5.86%.
Figure 2 shows key levels for live Contingent income products. The average coupon barrier is calculated at 69% of the initial strike level but is now at 54%. This implies that on average the underlyings for these products have increased since product strike dates giving greater buffer to the coupon barrier level making them more likely to be paid. This is also reflected in the high return figure for live products due to the positive effect of growth in underlyings on product valuations. Figure 2 can also be used to give a very simplified view of typical product terms, the average coupon barrier and barrier are quite similar and both well below the strike level. In general these product require no underlying growth to pay their maximum return and will continue to pay the contingent coupon even if there is a significant fall in the underlying asset.
Figure 2: Key Levels for contingent income products (StructrPro.com)
| FEATURE | INITIAL (%) | CURRENT (%) | NUMBER |
| Coupon | 68.98 | 53.71 | 341 |
| Autocall | 0 | ||
| Strike | 100 | 77.94 | 341 |
| Barrier | 60.29 | 47.88 | 303 |
Underlying choices
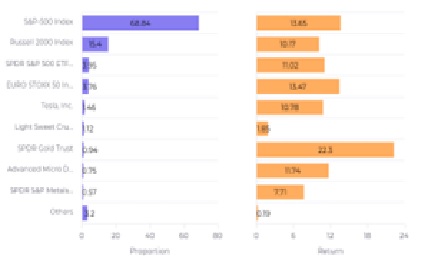
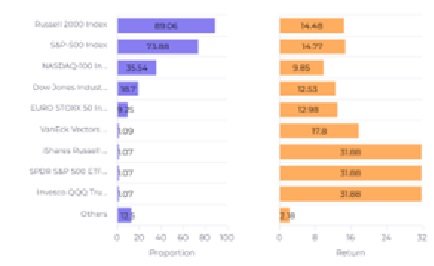
Most contingent income products are linked to more than one underlying and performance will typically be dependent on the worst performing of the basket in order to boost yield. However, most products are linked to major indices as shown in the underlying breakdowns in Figure 3. For single asset products the S&P 500 Index is the most popular underlying whilst for multi asset products the most common underlying across products is the Russell 2000 index, followed by the S&P 500 in second place. Alternatives to major benchmark indices are ETF and single stock linked products although these make up a much smaller percentage.
Figure 3: Underlying breakdown for contingent income products
| Breakdown by underlying for single asset | Breakdown by underlying for multi asset |
 |  |
Focus by product
StructrPro can also be used to analyse and track individual products in the market. Figure 4 shows one of the charts from the individual product page for a contingent income product linked to the Russell 2000 Index and Nasdaq 100 index. It struck in March 2022 and will mature in March 2024. The chart shows the underlying evolution, coupons paid and future coupon points along with key product barriers and levels. There is also the functionality to show future evolution so can visualise scenarios such as the effect of a 10% per annum decline in both underlyings as shown here.
Figure 4: Events and timeline for product linked to Russell 2000 Index and Nasdaq 100 index
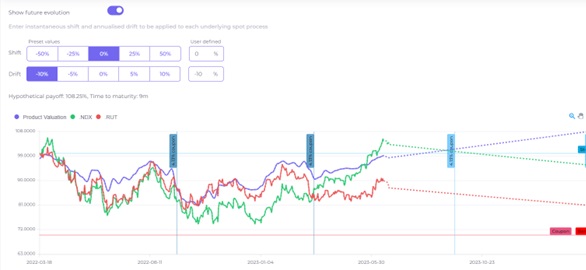
The use of coupon barriers to provide higher yield through contingent income is a popular feature of several product types so the concept is familiar to structured product investors. Pure contingent income products are less common than the autocall variants but do offer an attractive alternative to other traditional income investments at a fixed maturity without the complication of calls or autocalls. These products are typically defensive in terms of underlying growth so returns can have low correlation to market performance and represent a viable controlled risk vehicle to generate attractive yield levels.
Tags: LifecycleA version of this article has also appeared on www.structuredretailproducts.com
Image courtesy of: Carl Raw / unsplash.com