
Analysing index linked products with StructrPro
The StructrPro structured product and lifecycle service provides deep analysis on the US structured products market. It is jointly run by SRP and FVC and covers some 70,000 products issued in recent years. Performance analysis can be seen at an individual product level and on portfolios of multiple products. The application shows results for both matured and live products for any portfolio in the US market.
Showing product performance
In general, presenting structured product performance in a meaningful way is not as easy as might be first anticipated. The simplest place to start is analysing matured products and this is the indicator of product performance most used by distributors, advisers and commentators in the industry. In most active markets structured products are issued continuously and therefore there is usually a corresponding steady stream of maturities which allows performance to be calculated for a set of products. We can analyse the average, maximum and minimum returns over any time period such as a calendar year. It is then possible to see if these meet investor expectations and compare favourably to other simple investments such as cash deposit rates over the same period.
Analysis of structured products is simplest for fixed term capital protected products. However the Auto-call product type tends to dominate structured products markets as they have been the most popular product type for many years. This has two important consequences for reporting structured product maturity data.
Concentration of maturities
Firstly, we typically observe a clustering effect in that during times of growth or a significant rebound trend of the market there is a trigger of a large number of products calling in a short space of time. This is because if products have been struck with the next auto-call level in a certain points range (e.g. 3500 to 4000 for the S&P-500) then these products will be called at their next respective opportunity as the market rises through those levels. This has significant effect in the market as it makes available a large amount of funds to be reinvested from investors because of the product maturities and from those investors that have just had a positive experience. By contrast in times of down markets products take longer to call (or mature) and the money is not freed up as quickly.
Secondly, it is the nature of Auto-calls that positive outcomes occur earlier in the product lifetime and that flat or negative outcomes will only happen at maturity once the product has missed all opportunities to call. Therefore, we tend to see more positive results early in a new or increasing issuance cycle with potentially worse performances coming later on. Assessment of a portfolio of structured products divides into those that have previously matured products and those that are still live. This is equally as true for an individual investor’s portfolio as for an assessment of a country or region.
In-life versus matured
There can often be a disconnect between previous maturities and the behaviour of live products. For assessment of live products it is natural to use its live price but these are heavily dependent on current underlying spot levels and other parameters such as volatility. Live (or secondary market) valuations tend to exacerbate short term effects. This was seen recently during the COVID market sell off in 2020 when valuations of live capital-at-risk products were suddenly impacted by dramatic falls in the underlying and large increases in volatility. Most of these products recovered before maturity.
This can be illustrated by products linked to the Russell 2000 Index. There are over 1400 products linked solely to this index on the StructrPro application.
The overall breakdown of products is given in the following table
| NUMBER | LIVE | MATURED |
| Gain | 301 | 423 |
| Loss | 551 | 174 |
| Return p.a. | -0.0324 | -0.0012 |
| SP payoff | 0.9389 | 0.9962 |
| Underlying level | 0.8953 | 1.0032 |
| Time gone | 1.47 y | 1.6 y |
Figure 1: Summary of Russell 2000 linked products
A more granular analysis of performance of matured products can be seen in the chart below.
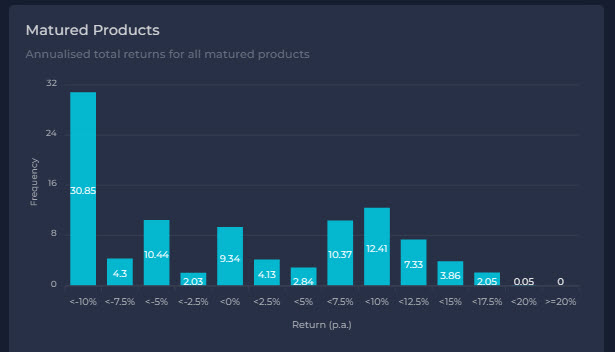
Figure 2: Product maturities for Russell 2000 products
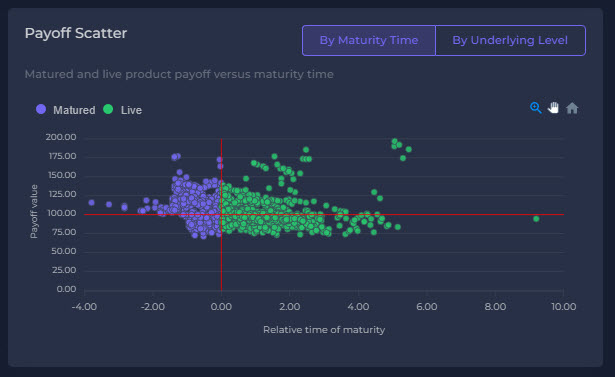
Figure 3: Individual breakdown of product maturities and current live products
The analysis of previous maturities shows that while most products made a gain a significant number did lose money. As is demonstrated on the chart, most of these losses were experienced in the last year during the recent market declines. One example product is a one year capped buffered leveraged return note that matured in May 2022. During that time the index was down nearly 20% but because of the 5% buffer the product loss would have been smaller than for the index itself.
The right-hand side of the chart shows a similar picture given the current state of products that are live. Many of these products have valuations significantly in excess of 100%. One such example is a three times geared Leveraged Growth product which is 6 months into a 15 month term. Although the index is only up 4% since inception the product valuation is up to nearly 20% because of the geared return.
These examples and findings show how presenting structured product performance data can be done in a meaningful but accessible way. It is of great value to advisers and investors to be able to get such insights to understand how the market is performing.
Tags: LifecycleA version of this article has also appeared on www.structuredretailproducts.com
Image courtesy of: Mario Dobelmann / unsplash.com