
UK Structured Product Trends
The Structured Edge service offers coverage of both active and matured products. This platform powered by FVC gives significant insights into market trends, allowing a deeper understanding of the overall performance and long-term evolution of the products.
Key trends in product maturities in the UK are analysed in this article. 2024 was an active and successful year in the UK market with 822 new structured products launched. The increasing popularity of structured products among investors and Independent Financial Advisors (IFAs) is fuelled by their attractiveness as defined investment solutions that provide strong potential returns with downside protection.
Evolving investor preferences and market trends
Performance has been strong in recent years and the rest of this study looks at products striking between Jan 2022 to December 2024

Figure 1 shows the product strikes from January 2022 to December 2024 that we will cover. A total of 1,348 at-risk growth products have been issued and these have the largest share of the market. The standing of at-risk growth products highlights the preference among investors for targeted strategies with some capital risk. Over the period we have analysed, there is a slight change in investor preference resulting in a steady increase of protected growth and at-risk income products. The need for balance in portfolio construction is one of the reasons for the increasing interest in these product types. Investors are looking for diversification strategies that balance risk and return in their investments.
The growing demand for protected income products, particularly from the middle of 2023, demonstrates the expanding understanding of the importance of protecting capital and ensuring consistent returns. This also coincided with a period of rising interest rates which makes such products easier to structure. This shift is consistent with investors’ priorities evolving amidst financial uncertainty, including inflationary pressures, rises in interest rates, and fears of a recession.
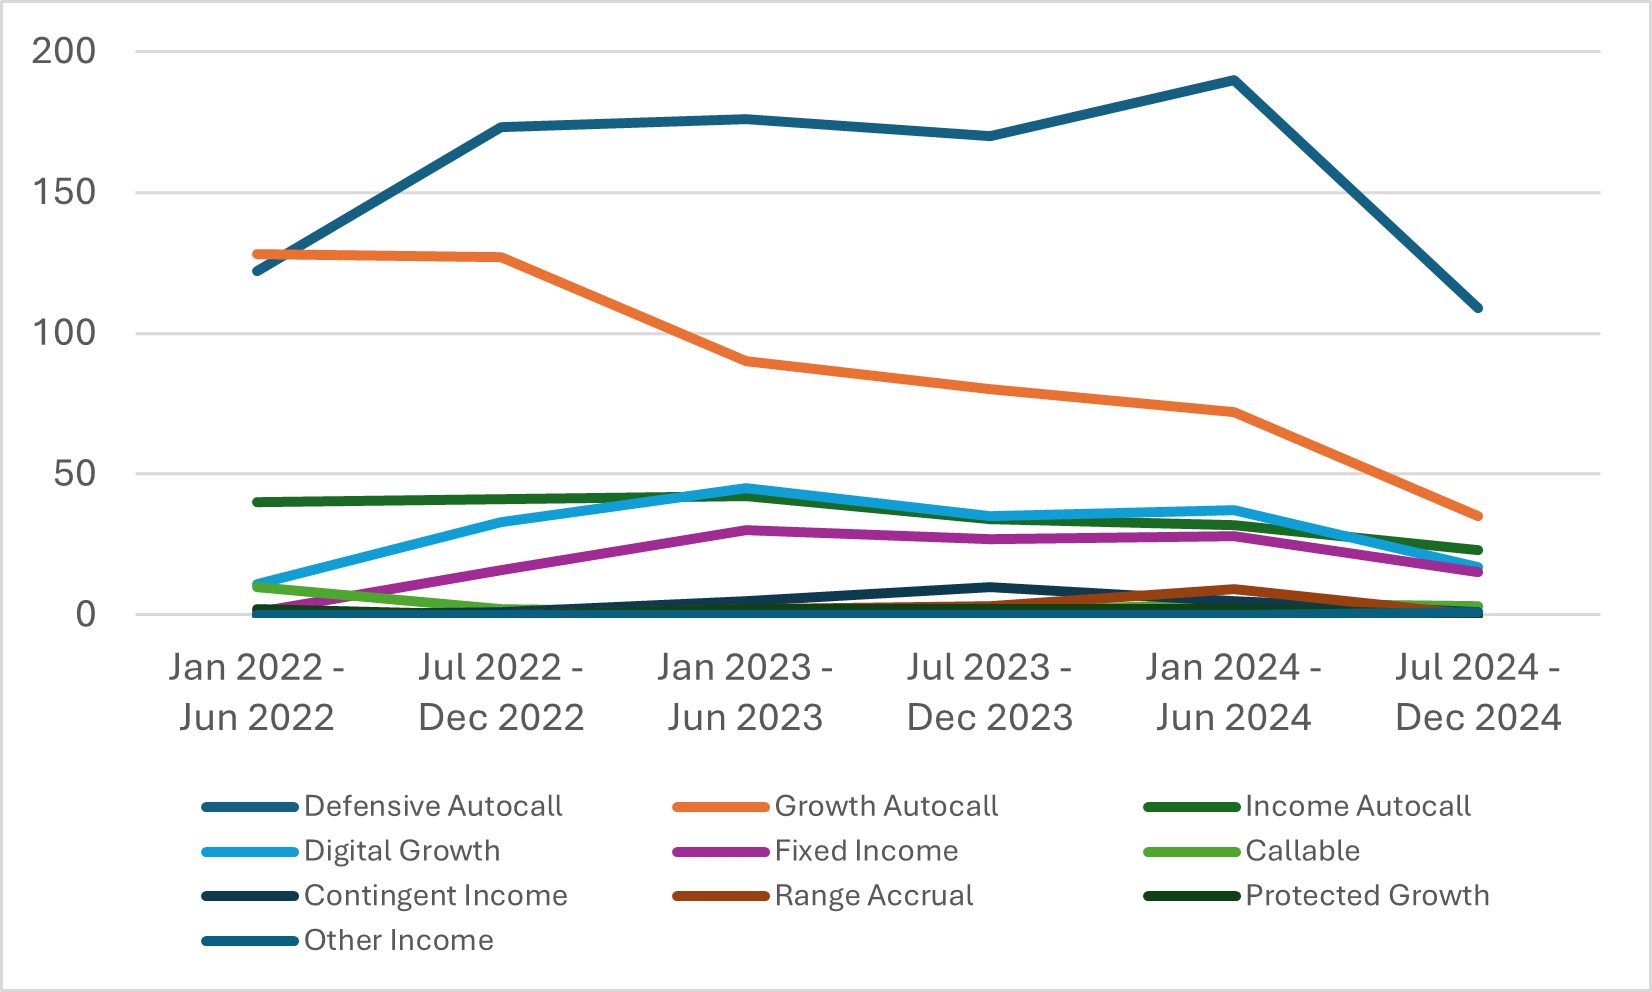
Figure 2 shows that defensive autocall products demonstrated the strongest growth among all structured product types, with122 products in the six-month period from January 2022 to June 2022 to 190 products from January 2024 to June 2024. The volume continued to grow, reaching 940 in the whole observation period solidifying its position as the most popular product type. In an uncertain market environment, investors prefer strategies with a high degree of capital protection.
The growth autocall evolution presents a different position. Despite starting strong and maintaining stability until mid-2022, it showed a consistent decline in numbers thereafter. A broader market transition from growth-oriented to more defensive investment strategies is reflected in the reduction of new growth autocall products by the end of 2024.
The issuance of most structured product types will benefit from better terms when interest rates rise. It particularly benefits digital growth and fixed-income products and therefore makes them more popular, especially for investors seeking income solutions that aim to pay above the risk-free rate with controlled risk.
Performance breakdown by product type and underlying assets

Figure 3 shows the breakdown of maturity performances for different product types. . The left and right panels show the distribution and returns of various product types. Similar to the continued evolution of newer products that have struck this year the defensive autocall with 43% is the most dominant product type. This is followed by the growth autocall at 26% and the income autocall at 11%. The highest return was achieved by growth autocall calls at 7. 42% p.a., closely followed by income autocall at 7. 26% p.a.. Defensive autocalls delivered a return of 5. 94%, a lower figure due to the greater protection afforded. The market has a strong preference for autocall products because of their attractive risk-return profiles. Different types of autocalls make up the first three product types and this has been typical for UK structured products for many years.
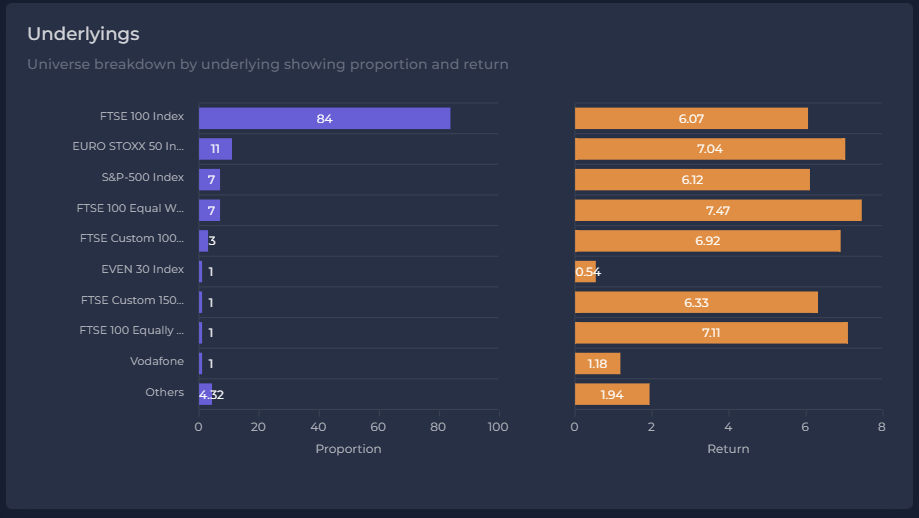
Figure 4 shows a breakdown of structured products by different underlyings. The proportional allocation to each underlying is shown on the left-hand side of the bar chart, while the corresponding returns for the respective products are shown on the right-hand side.
Between 2020-2024, the largest share of the market comes from products linked to the FTSE-100 Index with 84% market share in the UK market. This is no surprise given the index’s popularity with UK investors. The average return for all products is 6.07% over this period. The next most common underlyings are the EURO STOXX 50 Index and S&P 500 Index at 11% and 7% market share respectively. Their returns are 7.04% and 6.12%, which is similar to the FTSE-100 linked products. The structured product market has therefore delivered consistent returns across several underlyings. Other choices such as the FTSE 100 Equal Weighted Index also performed well.
Understanding trends in any market is fascinating, not only for analysing past developments but also for assessing future trends. The UK market remains very active into 2025 and its continued growth will depend on a good supply of products that perform strongly and the ability for advisers and investors to be able to select the most appropriate products.
Tags: Structured EdgeImage courtesy of: Gordon Williams / unsplash.com