
Understanding Greeks: step by step
The role of “Greeks” (or “sensitivities”) derivatives and structured products is very important. Greeks go hand in hand with option valuation, which is itself a very complex subject. During the lifetime of an option or structured product, an investment bank or other party can price a product based on market data and accepted pricing models to calculate a price at which the bank or other party would be prepared to trade in an instrument, whether selling or buying. Options exchanges provide a liquid environment for trading important options on many underlyings.
Greeks provide two important pieces of information, the hedging that a trader is required to undertake to manage the risk of derivatives or structured products, and the likely changes in the valuation of an option or structured product when market parameters move. These two effects are closely related.
This article and others to follow will consider some of the main “Greeks” in turn, namely Delta, Gamma, Vega, Theta, Vanna and Charm.
To understand Greeks fully, it is best to first consider the behaviour of a single call or put option. These are the simplest option-based instruments and structured products are then created by combining options with capital and income payments.
The most immediate Greek: Delta
This article will concentrate on “Delta”, the sensitivity of the option price to the underlying asset. It is the most important and immediate of all Greeks. When an option is traded, the first question asked is the size of the exposure to the market and therefore the delta hedge.
The chart below shows the theoretical price of a call and put option against the underlying spot price. The option is 2 years long and both call and put have strikes of 100 units. The volatility level is 20%, interest rates are 4% and dividend yield is 2%. These represent typical values for equity indices.
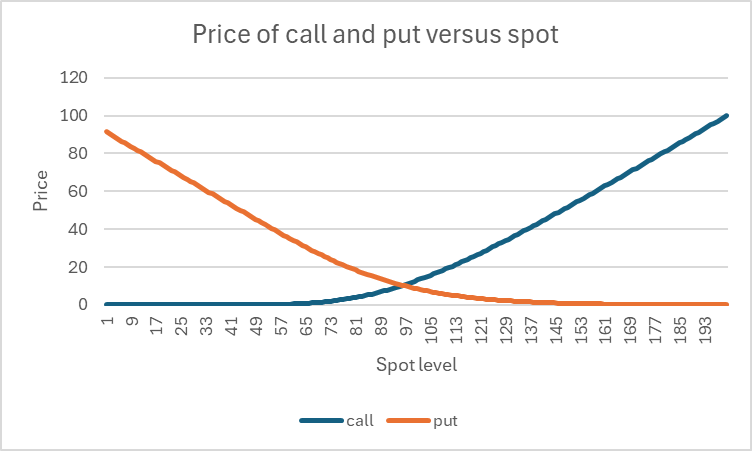
The most obvious property of this chart is that the call price increases with the current stock price, whereas the put price decreases. The price for the call and put are roughly equal for the strike price is equal to the current stock price. More accurately, the rule known as put-call parity states that they will be equal when the strike price is equal to the stock’s forward price, which in this example is 104.08. This is because the value of the upside and downside relative to this strike have equal value on a “risk-neutral” pricing basis.
Mathematical definition of Delta
Delta is defined as the sensitivity of the option price to the underlying, a “mathematical” derivative as opposed to a financial one. The theoretical basis that underpins the validity of the relationship between pricing and hedging is quite complex. It was first explored by Black and Scholes in their groundbreaking paper of 1973 that first set option pricing on a sound and rigorous footing.
For this article, we will content ourselves with the intuitive (and correct, as proven by Black and Scholes and others in a more general context later) definition as follows:
The sensitivity of an option pricing function, given by f(S,{mp}) to the stock price (Delta or D(S,{mp}) is given by:
where {mp} are other market parameters (including time to maturity), and ∂ represents a partial derivative with respect to S, obtained by changing S by a small amount while keeping all other parameters constant.
We can extract three sets of values from the pricing chart above to calculate the Delta at the spot level of 110.
| Spot | Call price | Put price |
| 109 | 18.36249 | 5.94808 |
| 110 | 19.06096 | 5.68575 |
| 111 | 19.76959 | 5.43359 |
While the mathematical derivative is based on an infinitesimal change in the spot price, in practice a wider interval is often used, particularly for Monte Carlo pricing or other techniques that introduce some noise into the pricing function. In such cases, it is best to calculate a derivative centred around the target level to reduce second-order effects that would distort the current Delta value.
Therefore, by setting a step size of h=1 unit, we can obtain an approximate Delta value at S=100 for both the call and put as follows:
Where f(.) represents either the call or put pricing function and D(S) is the corresponding Delta function.
Under this approach, we calculate the Delta (DC) of the call option (function C) at a strike of 110 as:
Similarly, the Delta (DP) of the put option (function P) is calculated as:
We observe that the Delta of the call is positive, while for the put is negative, which of course is consistent with the slope of the curves.
The full picture is given below:
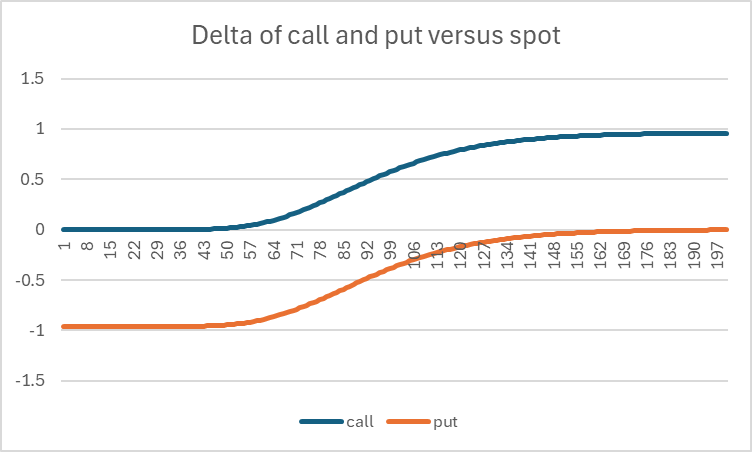
Delta behaviour for calls and puts
Note that the delta of the call option rises from 0 to (nearly) 1. When the spot value is down near zero, the option price is deeply out of the money and worth very little, even as the stock price starts to rise initially. Therefore, given that the price isn’t changing significantly the Delta is near zero. For very high stock prices, any further increase in price will likely directly translate to an equivalent increase in option payoff, meaning that the Delta is very nearly 1.
For spot levels close to at-the-money (the strike price), we could reasonably estimate that the chance of option payout is roughly 50%, as the stock price could end up or down from where it started. Consequently, an increase of the stock price by 1 point from this level will result in an extra payoff half the time, leading to an expected Delta of around 0.5. This intuition is largely correct, as observed in the middle part of the chart.
We can also see that the Delta of the put option is roughly -1 for low spot values. Here the put is clearly in the money, so an increase in spot price will reduce the value of the put. For very high spot values, the put is now out of the money and nearly worthless. Therefore, we can expect a Delta close to zero in this zone, which is consistent with the chart.
It is also evident that the difference between call Delta and put Delta is constant (a difference of 1) for all spot values. This is a direct consequence of put-call parity.
Delta describes the sensitivity of the option price to changes in the underlying and therefore can be directly used to estimate the change in valuation from today due to a small change in the underlying value. However, this is subject to second- and higher-order effects, which will be coming into play and which will be described in subsequent articles, starting with Gamma, the second-order rate of change with respect to the underlying.
Referring back to Figure 2, the call price at a spot value of 110 is given by 19.061 and the Delta was calculated as 0.70355. This implies that if the spot increases to 111 or decreases to 109, we can expect an approximately linear change in the option price. The predicted values for the call and put options are shown in the table below and closely match the actual values.
| Spot | Estimated Call price | Estimated Put price |
| 109 | 18.3625 | 5.94808 |
| 111 | 19.7696 | 5.43359 |
The application of the Delta value in constructing a hedge will be examined in the next article, which will also consider second-order spot price effects (“Gamma”).
Tags: Structured EdgeImage courtesy of: Jeff W / unsplash.com